Best Online Data Science Course Training - Coimbatore
In Collaboration with ![]()

Mode of Training: Classroom Training in Hyderabad, Bangalore, Chennai and Pune. For all other locations - either hybrid training model or online only, basis student's choice

 15,000+ Reviews
 660 Reviews

Data Scientist

Programmer Analyst


96%
of participants who met the conditions got placed

98%
Program Satisfaction

98%
Program Completion Rate
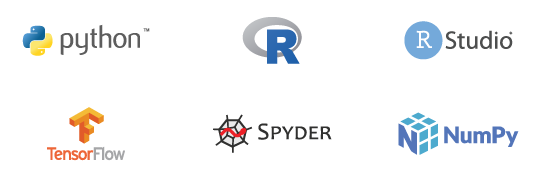
Tools Covered
The Data Science course is vast and consists of many interesting concepts like Big Data, Machine Learning, Data Warehousing, Data Mining and Visualization, Forecasting, Cloud Computing, Deep Learning, Neural Networks, and Business Intelligence. The Data Science Training in Coimbatore uses various tools for this process.

Industry Masterclass by 20+ Years of Industry Experts

Distributed Computing Spark & PySpark
Processing big data with lightning speed

Git Account creation & Google Colab
Master project management and cloud-based GUI

ML on Cloud - AWS, Azure, GCP - AutoML
Build ML algorithms without writing a single line of code
Data Ingestion using Python (Included in Python Programming)
Must know skill to begin data science journey

Facebook Prophet & ARIMA Variants
New era of timeseries / forecasting algorithms
MLOps
New breed of end-to-end seamless pipeline building

Data Engineering - Data Warehouse, ETL, ELT, Data Lake, Data Lakehouse, Data Pipeline, etc.
Boasts of more in-demand skill than data science

IBM Watson Cognitive Computing AutoML By IBM
Experience the enhanced IBM Watson capability
Data Science Certificates from Industry Leaders
In terms of providing cognitive approaches and consulting services, SUNY is a pioneer.
SUNY invests $6 billion yearly in development and research and has long-standing expertise in data sciences and artificial intelligence.
The goal of 360DigiTMG's partnership with SUNY is to help introduce learners in order integrated blended educational experiences with the aid of our well designed, globally recognised curriculum.
A renowned trade organisation in India that supports and advances the goals of the IT and business process management (BPM) industries is called NASSCOM.
For decades, NASSCOM has been actively engaged in research and development related to data science and artificial intelligence.
The goal of 360DigiTMG's partnership with NASSCOM is to empower students all around the world by introducing them to multimedia blended learning through the use of our top-notch, industry-aligned curriculum.
Program Fee details
Virtual Instructor-led Training (VILT)
- Live online classes - weekends & weekdays
- 365 days of access to online classes
- Avail Monthly EMI At zero Interest Rate
- Lifetime validity for LMS acces
- 20+ live hours of industry masterclasses from leading academicians and faculty from FT top 20 universities
- Career support services
Data Science Training in Coimbatore
The various stages of the course are explored in the trajectory of this Data Science program. This training begins with an introduction to Statistics, Probability, Python, and R programming. The student will then conceptualize Data Preparation, Data Cleansing, Exploratory Data Analysis, and Data Mining (Supervised and Unsupervised). Comprehend the theory behind Feature Engineering, Feature Extraction, and Feature Selection. Participants will also learn to perform Data Mining (Supervised) with Linear Regression and Predictive Modeling with Multiple Linear Regression Techniques. Data Mining Unsupervised using Clustering, Dimension Reduction, and Association Rules are also dealt with in detail.
A module is dedicated to scripting Machine Learning Algorithms and enabling Deep Learning and Neural Networks with Black Box techniques and SVM. All the stages delineated in the CRISP-ML(Q) framework for a Data Science Project are dealt with in great depth and clarity in this course. Undoubtedly this emerges as one of the best Data Science in Coimbatore due to the live project exposure in INNODATATICS. This gives a golden opportunity for students to apply the various concepts studies to a real-time situation.
What is Data Science?
Data science is an amalgam of methods derived from statistics, data analysis, and machine learning that are trained to extract and analyze huge volumes of structured and unstructured data.
Who is a Data Scientist?
A Data Scientist is a researcher who has to prepare huge volumes of big data for analysis, build complex quantitative algorithms to organize and synthesize the information, and present the findings with compelling visualizations to senior management. He enhances business decision-making by introducing greater speed and better direction to the entire process.
A Data Scientist must be a person who loves playing with numbers and figures. A strong analytical mindset coupled with strong industrial knowledge is the skill set most desired. He must possess above-average communication skills and must be adept at communicating technical concepts to non-technical people.
Data Scientists need a strong foundation in Statistics, Mathematics, Linear Algebra, Computer Programming, Data Warehousing, Mining, and Modeling to build winning algorithms. They must be proficient in tools such as Python, R, R Studio, Hadoop, MapReduce, Apache Spark, Apache Pig, Java, NoSQL database, Cloud Computing, Tableau, and SAS.
Outcomes of Data Science Program in Coimbatore
In this data-driven environment, 360DigiTMG's certification prepares you for the surging demand for Big Data skills and technology in all the leading industries. There is a huge career prospect available in the field of data science and our certification program is one of the most comprehensive in the industry today. This data science course in Coimbatore is specially designed to suit both data professionals and beginners who want to make a career in this fast-growing profession. This training will equip the students with logical and relevant programming abilities to build database models. They will be able to create simple machine learning algorithms like K-Means Clustering, Decision Trees, and Random Forest to solve problems and communicate the solutions effectively. In three months, students will also explore the key techniques such as Statistical Analysis, Regression Analysis, Data Mining, Machine Learning, Forecasting and Text Mining, and scripting algorithms for the same with Python and R Programming. Understand the key concepts of Neural Networks and study Deep Learning Black Box techniques like SVM.
Block Your Time


Who Should Sign Up?
- IT Engineers
- Data and Analytics Manager
- Business Analysts
- Data Engineers
- Banking and Finance Analysts
- Marketing Managers
- Supply Chain Professionals
- HR Managers
Data Science Course Syllabus in Coimbatore
This data science program follows the CRISP-ML(Q) Methodology. The premier modules are devoted to a foundational perspective of Statistics, Mathematics, Business Intelligence, and Exploratory Data Analysis. The successive modules deal with Probability Distribution, Hypothesis Testing, Data Mining Supervised, Predictive Modelling - Multiple Linear Regression, Lasso And Ridge Regression, Logistic Regression, Multinomial Regression, and Ordinal Regression. Later modules deal with Data Mining Unsupervised Learning, Recommendation Engines, Network Analytics, Machine Learning, Decision Tree and Random Forest, Text Mining, and Natural Language Processing. The final modules deal with Machine Learning - classifier techniques, Perceptron, Multilayer Perceptron, Neural Networks, Deep Learning Black-Box Techniques, SVM, Forecasting, and Time Series algorithms. This is the most enriching training program in terms of the array of topics covered.
- Introduction to Python Programming
- Installation of Python & Associated Packages
- Graphical User Interface
- Installation of Anaconda Python
- Setting Up Python Environment
- Data Types
- Operators in Python
- Arithmetic operators
- Relational operators
- Logical operators
- Assignment operators
- Bitwise operators
- Membership operators
- Identity operators
- Check out the Top Python Programming Interview Questions and Answers here.
- Data structures
- Vectors
- Matrix
- Arrays
- Lists
- Tuple
- Sets
- String Representation
- Arithmetic Operators
- Boolean Values
- Dictionary
- Conditional Statements
- if statement
- if - else statement
- if - elif statement
- Nest if-else
- Multiple if
- Switch
- Loops
- While loop
- For loop
- Range()
- Iterator and generator Introduction
- For – else
- Break
- Functions
-
- Purpose of a function
- Defining a function
- Calling a function
- Function parameter passing
- Formal arguments
- Actual arguments
- Positional arguments
- Keyword arguments
- Variable arguments
- Variable keyword arguments
- Use-Case *args, **kwargs
-
- Function call stack
- Locals()
- Globals()
- Stackframe
- Modules
- Python Code Files
- Importing functions from another file
- __name__: Preventing unwanted code execution
- Importing from a folder
- Folders Vs Packages
- __init__.py
- Namespace
- __all__
- Import *
- Recursive imports
- File Handling
- Exception Handling
- Regular expressions
- Oops concepts
- Classes and Objects
- Inheritance and Polymorphism
- Multi-Threading
- What is a Database
- Types of Databases
- DBMS vs RDBMS
- DBMS Architecture
- Normalisation & Denormalization
- Install PostgreSQL
- Install MySQL
- Data Models
- DBMS Language
- ACID Properties in DBMS
- What is SQL
- SQL Data Types
- SQL commands
- SQL Operators
- SQL Keys
- SQL Joins
- GROUP BY, HAVING, ORDER BY
- Subqueries with select, insert, update, delete statements
- Views in SQL
- SQL Set Operations and Types
- SQL functions
- SQL Triggers
- Introduction to NoSQL Concepts
- SQL vs NoSQL
- Database connection SQL to Python
- Check out the SQL for Data Science One Step Solution for Beginners here.
Learn about insights on how data is assisting organizations to make informed data-driven decisions. Gathering the details about the problem statement would be the first step of the project. Learn the know-how of the Business understanding stage. Deep dive into the finer aspects of the management methodology to learn about objectives, constraints, success criteria, and the project charter. The essential task of understanding business Data and its characteristics is to help you plan for the upcoming stages of development. Check out the CRISP - Business Understanding here.
- All About 360DigiTMG & Innodatatics Inc., USA
- Dos and Don'ts as a participant
- Introduction to Big Data Analytics
- Data and its uses – a case study (Grocery store)
- Interactive marketing using data & IoT – A case study
- Course outline, road map, and takeaways from the course
- Stages of Analytics - Descriptive, Predictive, Prescriptive, etc.
- Cross-Industry Standard Process for Data Mining
- Typecasting
- Handling Duplicates
- Outlier Analysis/Treatment
- Winsorization
- Trimming
- Local Outlier Factor
- Isolation Forests
- Zero or Near Zero Variance Features
- Missing Values
- Imputation (Mean, Median, Mode, Hot Deck)
- Time Series Imputation Techniques
- 1) Last Observation Carried Forward (LOCF)
- 2) Next Observation Carried Backward (NOCB)
- 3) Rolling Statistics
- 4) Interpolation
- Discretization / Binning / Grouping
- Encoding: Dummy Variable Creation
- Transformation
- Transformation - Box-Cox, Yeo-Johnson
- Scaling: Standardization / Normalization
- Imbalanced Handling
- SMOTE
- MSMOTE
- Undersampling
- Oversampling
In this module, you will learn about dealing with the Data after the Collection. Learn to extract meaningful information about Data by performing Uni-variate analysis which is the preliminary step to churn the data. The task is also called Descriptive Analytics or also known as exploratory data analysis. In this module, you also are introduced to statistical calculations which are used to derive information along with Visualizations to show the information in graphs/plots
- Machine Learning project management methodology
- Data Collection - Surveys and Design of Experiments
- Data Types namely Continuous, Discrete, Categorical, Count, Qualitative, Quantitative and its identification and application
- Further classification of data in terms of Nominal, Ordinal, Interval & Ratio types
- Balanced versus Imbalanced datasets
- Cross Sectional versus Time Series vs Panel / Longitudinal Data
- Time Series - Resampling
- Batch Processing vs Real Time Processing
- Structured versus Unstructured vs Semi-Structured Data
- Big vs Not-Big Data
- Data Cleaning / Preparation - Outlier Analysis, Missing Values Imputation Techniques, Transformations, Normalization / Standardization, Discretization
- Sampling techniques for handling Balanced vs. Imbalanced Datasets
- What is the Sampling Funnel and its application and its components?
- Population
- Sampling frame
- Simple random sampling
- Sample
- Measures of Central Tendency & Dispersion
- Population
- Mean/Average, Median, Mode
- Variance, Standard Deviation, Range
The raw Data collected from different sources may have different formats, values, shapes, or characteristics. Cleansing, or Data Preparation, Data Munging, Data Wrapping, etc., are the next steps in the Data handling stage. The objective of this stage is to transform the Data into an easily consumable format for the next stages of development.
- Feature Engineering on Numeric / Non-numeric Data
- Feature Extraction
- Feature Selection
- Forward Feature Selection
- Backward Feature Selection
- Exhaustive Feature Selection
- Recursive feature elimination (RFE)
- Chi-square Test
- Information Gain
- What is Power BI?
- Power BI Tips and Tricks & ChatGPT Prompts
- Overview of Power BI
- Architecture of PowerBI
- PowerBI and Plans
- Installation and introduction to PowerBI
- Transforming Data using Power BI Desktop
- Importing data
- Changing Database
- Data Types in PowerBI
- Basic Transformations
- Managing Query Groups
- Splitting Columns
- Changing Data Types
- Working with Dates
- Removing and Reordering Columns
- Conditional Columns
- Custom columns
- Connecting to Files in a Folder
- Merge Queries
- Query Dependency View
- Transforming Less Structured Data
- Query Parameters
- Column profiling
- Query Performance Analytics
- M-Language
Learn the preliminaries of the Mathematical / Statistical concepts which are the foundation of techniques used for churning the Data. You will revise the primary academic concepts of foundational mathematics and Linear Algebra basics. In this module, you will understand the importance of Data Optimization concepts in Machine Learning development. Check out the Mathematical Foundations here.
- Data Optimization
- Derivatives
- Linear Algebra
- Matrix Operations
Data mining unsupervised techniques are used as EDA techniques to derive insights from the business data. In this first module of unsupervised learning, get introduced to clustering algorithms. Learn about different approaches for data segregation to create homogeneous groups of data. In hierarchical clustering, K means clustering is the most used clustering algorithm. Understand the different mathematical approaches to perform data segregation. Also, learn about variations in K-means clustering like K-medoids, and K-mode techniques, and learn to handle large data sets using the CLARA technique.
- Clustering 101
- Distance Metrics
- Hierarchical Clustering
- Non-Hierarchical Clustering
- DBSCAN
- Clustering Evaluation metrics
Dimension Reduction (PCA and SVD) / Factor Analysis Description: Learn to handle high dimensional data. The performance will be hit when the data has a high number of dimensions and machine learning techniques training becomes very complex, as part of this module you will learn to apply data reduction techniques without any variable deletion. Learn the advantages of dimensional reduction techniques. Also, learn about yet another technique called Factor Analysis.
- Prinicipal Component Analysis (PCA)
- Singular Value Decomposition (SVD)
Learn to measure the relationship between entities. Bundle offers are defined based on this measure of dependency between products. Understand the metrics Support, Confidence, and Lift used to define the rules with the help of the Apriori algorithm. Learn the pros and cons of each of the metrics used in Association rules.
- Association rules mining 101
- Measurement Metrics
- Support
- Confidence
- Lift
- User Based Collaborative Filtering
- Similarity Metrics
- Item Based Collaborative Filtering
- Search Based Methods
- SVD Method
The study of a network with quantifiable values is known as network analytics. The vertex and edge are the nodes and connection of a network, learn about the statistics used to calculate the value of each node in the network. You will also learn about the google page ranking algorithm as part of this module.
- Entities of a Network
- Properties of the Components of a Network
- Measure the value of a Network
- Community Detection Algorithms
Learn to analyse unstructured textual data to derive meaningful insights. Understand the language quirks to perform data cleansing, extract features using a bag of words and construct the key-value pair matrix called DTM. Learn to understand the sentiment of customers from their feedback to take appropriate actions. Advanced concepts of text mining will also be discussed which help to interpret the context of the raw text data. Topic models using LDA algorithm, emotion mining using lexicons are discussed as part of NLP module.
- Sources of data
- Bag of words
- Pre-processing, corpus Document Term Matrix (DTM) & TDM
- Word Clouds
- Corpus-level word clouds
- Sentiment Analysis
- Positive Word clouds
- Negative word clouds
- Unigram, Bigram, Trigram
- Semantic network
- Extract, user reviews of the product/services from Amazon and tweets from Twitter
- Install Libraries from Shell
- Extraction and text analytics in Python
- LDA / Latent Dirichlet Allocation
- Topic Modelling
- Sentiment Extraction
- Lexicons & Emotion Mining
- Check out the Text Mining Interview Questions and Answers here.
- Machine Learning primer
- Difference between Regression and Classification
- Evaluation Strategies
- Hyper Parameters
- Metrics
- Overfitting and Underfitting
Revise Bayes theorem to develop a classification technique for Machine learning. In this tutorial, you will learn about joint probability and its applications. Learn how to predict whether an incoming email is spam or a ham email. Learn about Bayesian probability and its applications in solving complex business problems.
- Probability – Recap
- Bayes Rule
- Naïve Bayes Classifier
- Text Classification using Naive Bayes
- Checking for Underfitting and Overfitting in Naive Bayes
- Generalization and Regulation Techniques to avoid overfitting in Naive Bayes
- Check out the Naive Bayes Algorithm here.
k Nearest Neighbor algorithm is a distance-based machine learning algorithm. Learn to classify the dependent variable using the appropriate k value. The KNN Classifier also known as a lazy learner is a very popular algorithm and one of the easiest for application.
- Deciding the K value
- Thumb rule in choosing the K value.
- Building a KNN model by splitting the data
- Checking for Underfitting and Overfitting in KNN
- Generalization and Regulation Techniques to avoid overfitting in KNN
In this tutorial, you will learn in detail about the continuous probability distribution. Understand the properties of a continuous random variable and its distribution under normal conditions. To identify the properties of a continuous random variable, statisticians have defined a variable as a standard, learning the properties of the standard variable and its distribution. You will learn to check if a continuous random variable is following normal distribution using a normal Q-Q plot. Learn the science behind the estimation of value for a population using sample data.
- Probability & Probability Distribution
- Continuous Probability Distribution / Probability Density Function
- Discrete Probability Distribution / Probability Mass Function
- Normal Distribution
- Standard Normal Distribution / Z distribution
- Z scores and the Z table
- QQ Plot / Quantile - Quantile plot
- Sampling Variation
- Central Limit Theorem
- Sample size calculator
- Confidence interval - concept
- Confidence interval with sigma
- T-distribution Table / Student's-t distribution / T table
- Confidence interval
- Population parameter with Standard deviation known
- Population parameter with Standard deviation not known
Learn to frame business statements by making assumptions. Understand how to perform testing of these assumptions to make decisions for business problems. Learn about different types of Hypothesis testing and its statistics. You will learn the different conditions of the Hypothesis table, namely Null Hypothesis, Alternative hypothesis, Type I error, and Type II error. The prerequisites for conducting a Hypothesis test, and interpretation of the results will be discussed in this module.
- Formulating a Hypothesis
- Choosing Null and Alternative Hypotheses
- Type I or Alpha Error and Type II or Beta Error
- Confidence Level, Significance Level, Power of Test
- Comparative study of sample proportions using Hypothesis testing
- 2 Sample t-test
- ANOVA
- 2 Proportion test
- Chi-Square test
Data Mining supervised learning is all about making predictions for an unknown dependent variable using mathematical equations explaining the relationship with independent variables. Revisit the school math with the equation of a straight line. Learn about the components of Linear Regression with the equation of the regression line. Get introduced to Linear Regression analysis with a use case for the prediction of a continuous dependent variable. Understand about ordinary least squares technique.
- Scatter diagram
- Correlation analysis
- Correlation coefficient
- Ordinary least squares
- Principles of regression
- Simple Linear Regression
- Exponential Regression, Logarithmic Regression, Quadratic or Polynomial Regression
- Confidence Interval versus Prediction Interval
- Heteroscedasticity / Equal Variance
- Check out the Linear Regression Interview Questions and Answers here.
In the continuation of the Regression analysis study, you will learn how to deal with multiple independent variables affecting the dependent variable. Learn about the conditions and assumptions to perform linear regression analysis and the workarounds used to follow the conditions. Understand the steps required to perform the evaluation of the model and to improvise the prediction accuracies. You will be introduced to concepts of variance and bias.
- LINE assumption
- Linearity
- Independence
- Normality
- Equal Variance / Homoscedasticity
- Collinearity (Variance Inflation Factor)
- Multiple Linear Regression
- Model Quality metrics
- Deletion Diagnostics
- Check out the Linear Regression Interview Questions here.
You have learned about predicting a continuous dependent variable. As part of this module, you will continue to learn Regression techniques applied to predict attribute Data. Learn about the principles of the logistic regression model, understand the sigmoid curve, and the usage of cut-off value to interpret the probable outcome of the logistic regression model. Learn about the confusion matrix and its parameters to evaluate the outcome of the prediction model. Also, learn about maximum likelihood estimation.
- Principles of Logistic regression
- Types of Logistic regression
- Assumption & Steps in Logistic regression
- Analysis of Simple logistic regression results
- Multiple Logistic regression
- Confusion matrix
- False Positive, False Negative
- True Positive, True Negative
- Sensitivity, Recall, Specificity, F1
- Receiver operating characteristics curve (ROC curve)
- Precision Recall (P-R) curve
- Lift charts and Gain charts
- Check out the Logistic Regression Interview Questions and Answers here.
Learn about overfitting and underfitting conditions for prediction models developed. We need to strike the right balance between overfitting and underfitting, learn about regularization techniques L1 norm and L2 norm used to reduce these abnormal conditions. The regression techniques of Lasso and Ridge techniques are discussed in this module.
- Understanding Overfitting (Variance) vs. Underfitting (Bias)
- Generalization error and Regularization techniques
- Different Error functions, Loss functions, or Cost functions
- Lasso Regression
- Ridge Regression
- Check out the Lasso and Ridge Regression Interview Questions and Answers here.
Extension to logistic regression We have multinomial and Ordinal Logistic regression techniques used to predict multiple categorical outcomes. Understand the concept of multi-logit equations, baseline, and making classifications using probability outcomes. Learn about handling multiple categories in output variables including nominal as well as ordinal data.
- Logit and Log-Likelihood
- Category Baselining
- Modeling Nominal categorical data
- Handling Ordinal Categorical Data
- Interpreting the results of coefficient values
As part of this module, you learn further different regression techniques used for predicting discrete data. These regression techniques are used to analyze the numeric data known as count data. Based on the discrete probability distributions namely Poisson, negative binomial distribution the regression models try to fit the data to these distributions. Alternatively, when excessive zeros exist in the dependent variable, zero-inflated models are preferred, you will learn the types of zero-inflated models used to fit excessive zeros data.
- Poisson Regression
- Poisson Regression with Offset
- Negative Binomial Regression
- Treatment of data with Excessive Zeros
- Zero-inflated Poisson
- Zero-inflated Negative Binomial
- Hurdle Model
Support Vector Machines / Large-Margin / Max-Margin Classifier
- Hyperplanes
- Best Fit "boundary"
- Linear Support Vector Machine using Maximum Margin
- SVM for Noisy Data
- Non- Linear Space Classification
- Non-Linear Kernel Tricks
- Linear Kernel
- Polynomial
- Sigmoid
- Gaussian RBF
- SVM for Multi-Class Classification
- One vs. All
- One vs. One
- Directed Acyclic Graph (DAG) SVM
Kaplan Meier method and life tables are used to estimate the time before the event occurs. Survival analysis is about analyzing the duration of time before the event. Real-time applications of survival analysis in customer churn, medical sciences, and other sectors are discussed as part of this module. Learn how survival analysis techniques can be used to understand the effect of the features on the event using the Kaplan-Meier survival plot.
- Examples of Survival Analysis
- Time to event
- Censoring
- Survival, Hazard, and Cumulative Hazard Functions
- Introduction to Parametric and non-parametric functions
Decision Tree models are some of the most powerful classifier algorithms based on classification rules. In this tutorial, you will learn about deriving the rules for classifying the dependent variable by constructing the best tree using statistical measures to capture the information from each of the attributes.
- Elements of classification tree - Root node, Child Node, Leaf Node, etc.
- Greedy algorithm
- Measure of Entropy
- Attribute selection using Information gain
- Decision Tree C5.0 and understanding various arguments
- Checking for Underfitting and Overfitting in Decision Tree
- Pruning – Pre and Post Prune techniques
- Generalization and Regulation Techniques to avoid overfitting in Decision Tree
- Random Forest and understanding various arguments
- Checking for Underfitting and Overfitting in Random Forest
- Generalization and Regulation Techniques to avoid overfitting in Random Forest
- Check out the Decision Tree Questions here.
Learn about improving the reliability and accuracy of decision tree models using ensemble techniques. Bagging and Boosting are the go-to techniques in ensemble techniques. The parallel and sequential approaches taken in Bagging and Boosting methods are discussed in this module. Random forest is yet another ensemble technique constructed using multiple Decision trees and the outcome is drawn from the aggregating the results obtained from these combinations of trees. The Boosting algorithms AdaBoost and Extreme Gradient Boosting are discussed as part of this continuation module. You will also learn about stacking methods. Learn about these algorithms which are providing unprecedented accuracy and helping many aspiring data scientists win first place in various competitions such as Kaggle, CrowdAnalytix, etc.
- Overfitting
- Underfitting
- Voting
- Stacking
- Bagging
- Random Forest
- Boosting
- AdaBoost / Adaptive Boosting Algorithm
- Checking for Underfitting and Overfitting in AdaBoost
- Generalization and Regulation Techniques to avoid overfitting in AdaBoost
- Gradient Boosting Algorithm
- Checking for Underfitting and Overfitting in Gradient Boosting
- Generalization and Regulation Techniques to avoid overfitting in Gradient Boosting
- Extreme Gradient Boosting (XGB) Algorithm
- Checking for Underfitting and Overfitting in XGB
- Generalization and Regulation Techniques to avoid overfitting in XGB
- Check out the Ensemble Techniques Interview Questions here.
Time series analysis is performed on the data which is collected with respect to time. The response variable is affected by time. Understand the time series components, Level, Trend, Seasonality, Noise, and methods to identify them in a time series data. The different forecasting methods available to handle the estimation of the response variable based on the condition of whether the past is equal to the future or not will be introduced in this module. In this first module of forecasting, you will learn the application of Model-based forecasting techniques.
- Introduction to time series data
- Steps to forecasting
- Components to time series data
- Scatter plot and Time Plot
- Lag Plot
- ACF - Auto-Correlation Function / Correlogram
- Visualization principles
- Naïve forecast methods
- Errors in the forecast and it metrics - ME, MAD, MSE, RMSE, MPE, MAPE
- Model-Based approaches
- Linear Model
- Exponential Model
- Quadratic Model
- Additive Seasonality
- Multiplicative Seasonality
- Model-Based approaches Continued
- AR (Auto-Regressive) model for errors
- Random walk
- Check out the Time Series Interview Questions here.
In this continuation module of forecasting learn about data-driven forecasting techniques. Learn about ARMA and ARIMA models which combine model-based and data-driven techniques. Understand the smoothing techniques and variations of these techniques. Get introduced to the concept of de-trending and de-seasonalize the data to make it stationary. You will learn about seasonal index calculations which are used to re-seasonalize the result obtained by smoothing models.
- ARMA (Auto-Regressive Moving Average), Order p and q
- ARIMA (Auto-Regressive Integrated Moving Average), Order p, d, and q
- ARIMA, ARIMAX, SARIMAX
- AutoTS, AutoARIMA
- A data-driven approach to forecasting
- Smoothing techniques
- Moving Average
- Exponential Smoothing
- Holt's / Double Exponential Smoothing
- Winters / Holt-Winters
- De-seasoning and de-trending
- Seasonal Indexes
- RNN, Bidirectional RNN, Deep Bidirectional RNN
- Transformers for Forecasting
- N-BEATS, N-BEATSx
- N-HiTS
- TFT - Temporal Fusion Transformer
The Perceptron Algorithm is defined based on a biological brain model. You will talk about the parameters used in the perceptron algorithm which is the foundation of developing much complex neural network models for AI applications. Understand the application of perceptron algorithms to classify binary data in a linearly separable scenario.
- Neurons of a Biological Brain
- Artificial Neuron
- Perceptron
- Perceptron Algorithm
- Use case to classify a linearly separable data
- Multilayer Perceptron to handle non-linear data
Neural Network is a black box technique used for deep learning models. Learn the logic of training and weights calculations using various parameters and their tuning. Understand the activation function and integration functions used in developing a Artificial Neural Network.
- Integration functions
- Activation functions
- Weights
- Bias
- Learning Rate (eta) - Shrinking Learning Rate, Decay Parameters
- Error functions - Entropy, Binary Cross Entropy, Categorical Cross Entropy, KL Divergence, etc.
- Artificial Neural Networks
- ANN Structure
- Error Surface
- Gradient Descent Algorithm
- Backward Propagation
- Network Topology
- Principles of Gradient Descent (Manual Calculation)
- Learning Rate (eta)
- Batch Gradient Descent
- Stochastic Gradient Descent
- Minibatch Stochastic Gradient Descent
- Optimization Methods: Adagrad, Adadelta, RMSprop, Adam
- Convolution Neural Network (CNN)
- ImageNet Challenge – Winning Architectures
- Parameter Explosion with MLPs
- Convolution Networks
- Recurrent Neural Network
- Language Models
- Traditional Language Model
- Disadvantages of MLP
- Back Propagation Through Time
- Long Short-Term Memory (LSTM)
- Gated Recurrent Network (GRU)
- Sequence 2 Sequence Models
- Transformers
- Generative AI
- ChatGPT
- DALL-E-2
- Mid Journey
- Crayon
- What Is Prompt Engineering?
- Understanding Prompts: Inputs, Outputs, and Parameters
- Crafting Simple Prompts: Techniques and Best Practices
- Evaluating and Refining Prompts: An Iterative Process
- Role Prompting and Nested Prompts
- Chain-of-Thought Prompting
- Multilingual and Multimodal Prompt Engineering
- Generating Ideas Using "Chaos Prompting"
- Using Prompt Compression
SUNY University Syllabus
- Data Engineering, Machine Learning, & AWS
- Amazon S3 Simple Storage Service
- Data Movement
- Data Pipelines & Workflows
- Jupyter Notebook & Python
- Data Analysis Fundamentals
- Athena, QuickSight, & EMR
- Feature Engineering Overview
- Problem Framing & Algorithm Selection
- Machine Learning in SageMaker
- ML Algorithms in SageMaker
- Advanced SageMaker Functionality
- AI/ML Services
- Problem Formulation & Data Collection
- Data Preparation & SageMaker Security
- Model Training & Evaluation
- AI Services & SageMaker Applications
- Machine Learning
- Machine Learning Services
- Machine Learning Regression Models
- Machine Learning Classification Models
- Machine Learning Clustering Models
- Project Jupyter & Notebooks
- Azure Machine Learning Workspaces
- Azure Data Platform Services
- Azure Storage Accounts
- Storage Strategy
- Azure Data Factory
- Non-relational Data Stores
- Machine Learning Data Stores & Compute
- Machine Learning Orchestration & Deployment
- Model Features & Differential Privacy
- Machine Learning Model Monitoring
- Azure Data Storage Monitoring
- Data Process Monitoring
- Data Solution Optimization
- High Availability & Disaster Recovery
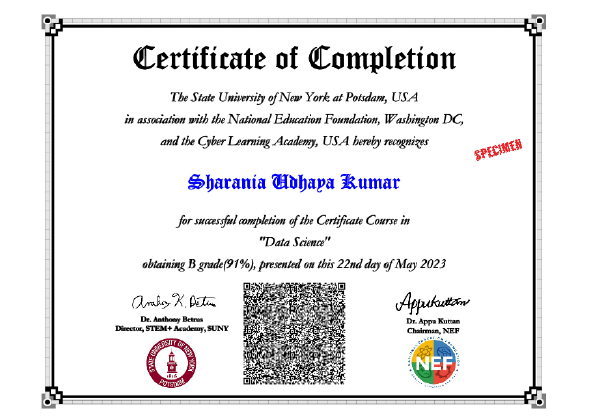
- Certificate Course in Data Science by SUNY
Data Science Panel of Coaches in Coimbatore

Bharani Kumar Depuru
Areas of expertise
Data Analytics, Digital Transformation,
Industrial Revolution 4.0.

Sharat Chandra Kumar
Areas of expertise
Data Science, Machine Learning,
Business Intelligence and Data Visualisation.

Bhargavi Kandukuri
Areas of expertise
Data Analytics,
Business Intelligence and Data Visualisation.
Alumni Speak

"The training was organised properly, and our instructor was extremely conceptually sound. I enjoyed the interview preparation, and 360DigiTMG is to credit for my successful placement.”
Pavan Satya
Senior Software Engineer

"Although data sciences is a complex field, the course made it seem quite straightforward to me. This course's readings and tests were fantastic. This teacher was really beneficial. This university offers a wealth of information."
Chetan Reddy
Data Scientist

"The course's material and infrastructure are reliable. The majority of the time, they keep an eye on us. They actually assisted me in getting a job. I appreciated their help with placement. Excellent institution.”
Santosh Kumar
Business Intelligence Analyst

"Numerous advantages of the course. Thank you especially to my mentors. It feels wonderful to finally get to work.”
Kadar Nagole
Data Scientist

"Excellent team and a good atmosphere. They truly did lead the way for me right away. My mentors are wonderful. The training materials are top-notch.”
Gowtham R
Data Engineer

"The instructors improved the sessions' interactivity and communicated well. The course has been fantastic.”
Wan Muhamad Taufik
Associate Data Scientist

"The instructors went above and beyond to allay our fears. They assigned us an enormous amount of work, including one very difficult live project. great location for studying.”
Venu Panjarla
AVP Technology
Data Science Trends in Coimbatore
The demand for Data Scientists is predicted to increase by 30% by 2025. With the inclusion of Cloud and IoT technologies, there has been an exponential growth of data that has led to the expansion of roles for data scientists in the field of Machine Learning and Big Data technology. In the times to come a Data scientist role will not be just subjected to technical aspects but will rise to more of a collaborator and a facilitators role. An entry-level fresher earns around Rs.4.0 lakhs. And if he decides to stay put for another 5 to 10 years on the job, he gets a handsome promotion to the Rs 7 to 11 lakhs per annum layer. If he persists and dedicates a lifetime to growing in his career he can garner anywhere from 25 lakhs to a whopping one crore per annum.
In India, Data Scientists have 4 job hops in 8 years with a 2-year tenure with each employer. They normally get a 60-100% salary increase on job changes. First, the aspirant joins as an intern or in a Junior position and then moves on to becoming a Senior Data Scientist. After this, he gets elevated to the Principal position and finally heads as Chief Data Scientist of the company. The top employers in Data Science are IBM, Accenture, JPMorgan Chase, Amex, McKinsey & Co, Impetus, Wipro, and Microsoft. Accenture offers the highest salary of Rs.19.6 lacs per annum.
Some of the top sightseeing places to see in Coimbatore, Adiyogi - The Source of Yoga, Sree Ayyappan Temple, Marudhamalai Arulmigu Subramanya Swami Temple, Sree Ayyappan Temple, Perur Patteeshwarar Temple, Brookefields Mall and many others.
Why Choose 360DigiTMG for Data Science Training Institute in Coimbatore?
Call us Today!
 +91 9989994319
Recommended Programmes
Data Scientist Course

 2064 Learners
Data Engineering Course
3021 Learners
Data Analytics Course
2915 Learners
Our Alumni Work At

"AI to contribute $16.1 trillion to the global economy by 2030. With 133 million more engaging, less repetitive jobs AI to change the workforce." - (Source). Data Science with Artificial Intelligence (AI) is a revolution in the business industry.. AI is potentially being adopted in automating many jobs leading to higher productivity, less cost, and extensible solutions. It is reported by PWC in a publication that about 50% of human jobs will be taken away by the AI in the next 5 years.
There is already a huge demand for AI specialists and this demand will be exponentially growing in the future. In the past few years, careers in AI have boosted concerning the demands of industries that are digitally transformed. The report of 2018 states that the requirements for AI skills have drastically doubled in the last three years, with job openings in the domain up to 119%.
FAQs
This is an excellent data science for beginners. 360DigiTMG is the best institute for data science training in Coimbatore. The course begins with an introduction to concepts in mathematics, statistics and data science. Students receive instruction in the world's most popular languages - Python and R.
You must have passed a Bachelor's degree in Mathematics, Statistics, Computer Science or Data Science. A Bachelor's degree in any engineering discipline is welcome. If you meet these requirements then you are eligible to join this course.
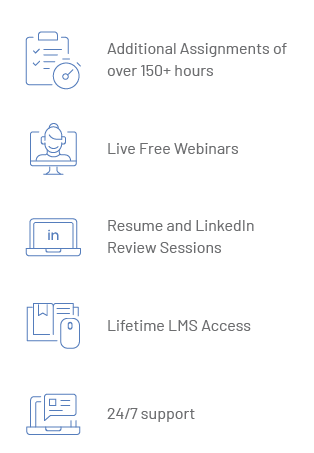
In this blended program, you will be attending 184 hours of classroom sessions of 4 months. After completion, you will have access to the online Learning Management System for another three months for recorded videos and assignments. The total duration of assignments to be completed online is 150 hours. Besides this, you will be working on a live project for a month.
The Data Science using Python and R programming offered by 360DigiTMG is one of the best data science in Coimbatore.
Yes. An individual can pursue a data science courses from a reputed institute after graduation. The institute must offer live project exposure via an internship program and possess industry-specific course material.
On an average a data scientist earns Rs.6,20,244 per annum in India. A Senior Data Scientist can expect ? 11,47,826 (Source).
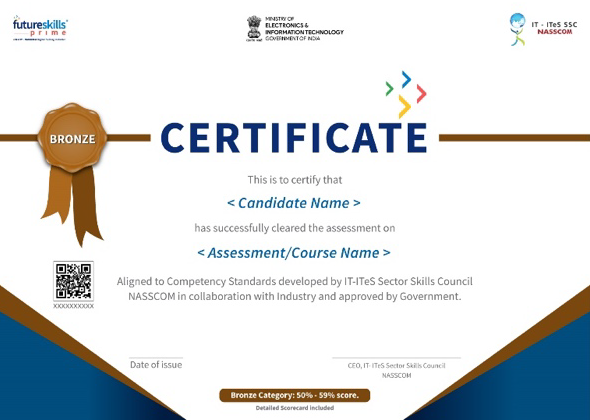
Yes. On submission of all assignments, you will receive a Course Completion Certificate. A sample of the certificate is available on our website for your reference.
Yes. We are proud to announce that we have received the TUV SUD rating of quality for our program.
Yes. Students can avail of our scholarship scheme titled " Jumpstart". 90% scholarship will be bestowed on deserving students.
The topics included in this course are
- Introduction to Python and R programming
- Exploratory Data Analysis
- Inferential Statistics
- Probability Distribution
- Data Visualization<
- Hypothesis Testing
- Data Mining Supervised Learning
- Predictive Modelling
- Regression Analysis
- Data Mining Unsupervised Learning
- Clustering
- Dimension reduction
- Association Rules
- Machine Learning
- Text Mining
- Natural Language Processing
- Neural Networks
- Deep Learning
- Black Box Techniques - SVM
- Forecasting/ Time Series
You will apprehend Python, R and R Studio in this course.
The course material can be downloaded from our online Learning Management System AISPRY.
Yes. We provide online tutorials in the course material. These can be accessed from our Learning Management System AISPRY.
If you miss a class, we will arrange for a recording of the session. You can then access it through the online Learning Management System.
Each classroom session is recorded on video and stored in our Learning Management System AISPRY. You will be assigned a dedicated login to AISPRY. You can access the video sessions from AISPRY.
After you have completed the classroom sessions, you will receive assignments through the online Learning Management System that you can access at your convenience. You will need to complete the assignments in order to obtain your certificate.
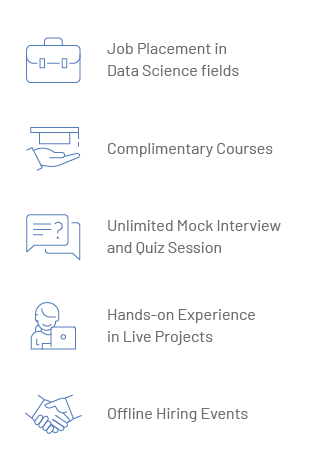
After the student receives the course completion certificate, he has to enroll for an internship with INNODATATICS Ltd. He will be assigned a live project that he has to complete in a month's time.
We assign mentors to each student in this program. Additionally, during the mentorship session, if the mentor feels that you require additional assistance, you may be referred to another mentor or trainer.
We provide end to end data science placement assistance after the internship is over. We help in resume preparation and conduct mock interviews. We also float your resume to several reliable placement consultants with whom we have a long association.
This Certificate is valid lifelong. 360DigiTMG has a pay once repeat many times offer on this course. You pay once for the course and can repeat it many times in the future for free. This helps you adapt to technological changes and software updates in the course of your career.

Jobs in the field of Data Science in Coimbatore
The top sectors creating the most data science jobs are BFSI, Energy, Pharmaceutical, Healthcare, E-commerce, Media, and Retail. The maximum demand for Data Scientists are in the Metros cities like Delhi-NCR and Mumbai. It’s demand is also catching up in emerging cities like Pune and Bangalore.

Salaries in Coimbatore for Data Scientist
The average salary of a Data Scientist is Rs.10.3 lakhs per annum in India. Professionals specializing in advanced analytics and predictive modelling can command higher salaries.

Data Science Projects in Coimbatore
The Indian government has initiated several data science projects in the fields of Agriculture, Electricity, Water, Healthcare, Education, Road Traffic Safety and Air Pollution. The Government of India has initiated several data science research initiatives as well.

Role of Open Source Tools in Analytics
Python and R are easy to learn and maintain and therefore, Godsend to developers in Data Science. Their extended libraries make it possible to stretch the applications of Python from Big Data Analytics to Machine Learning.

Modes of Training for Data Science with Python
The course in Coimbatore is designed to suit the needs of students as well as working professionals. We at 360DigiTMG give our students the option of both classroom and online learning. We also support e-learning as part of our curriculum.

Industry Application of Data Science
Data Science is used for securities fraud early warning, card fraud detection systems, demand enterprise risk management, analysis of healthcare information, seismic interpretation, reservoir characterization, energy exploration, traffic control and route planning.
Talk to your program advisors today!
Get your profile reviewed