

Power BI
Power BI Guide: Insights on Features, Tools & Charts
Discover the powerful features and tools that Power BI offers for data visualization. Our courses at 360DigiTMG enable you to master these skills, enhancing your data analytics capabilities.
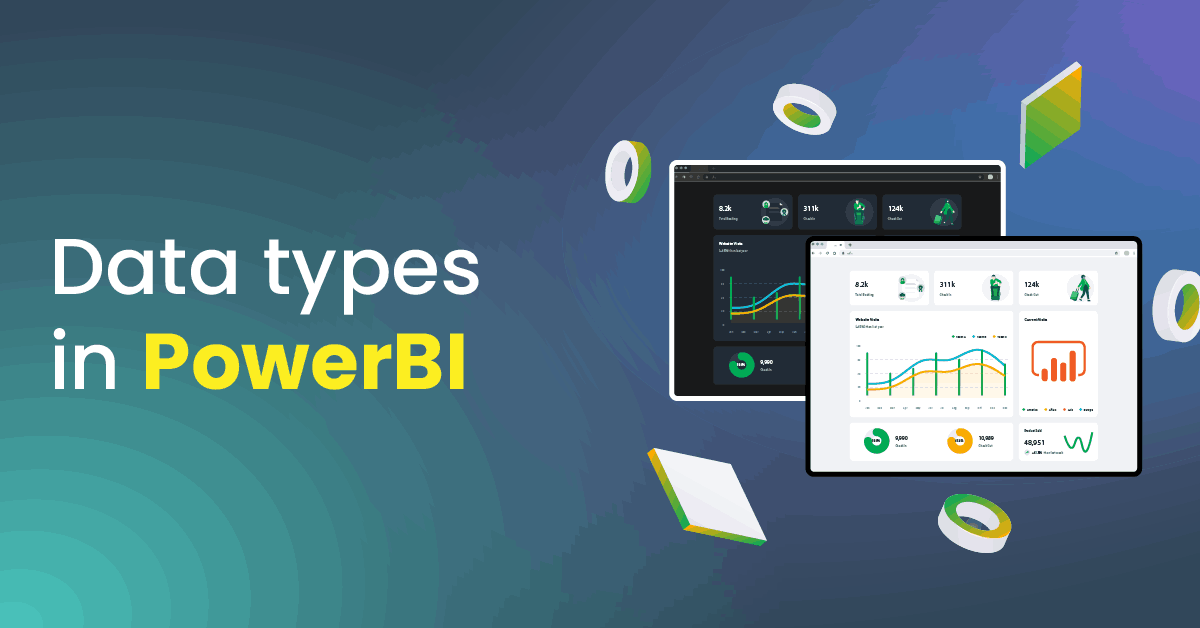
by Mr. Bharani Kumar 12171
In the captivating world of data analytics and visualization, the selection of data types in Power BI serves as the bedrock upon which the entire data narrative unfolds.
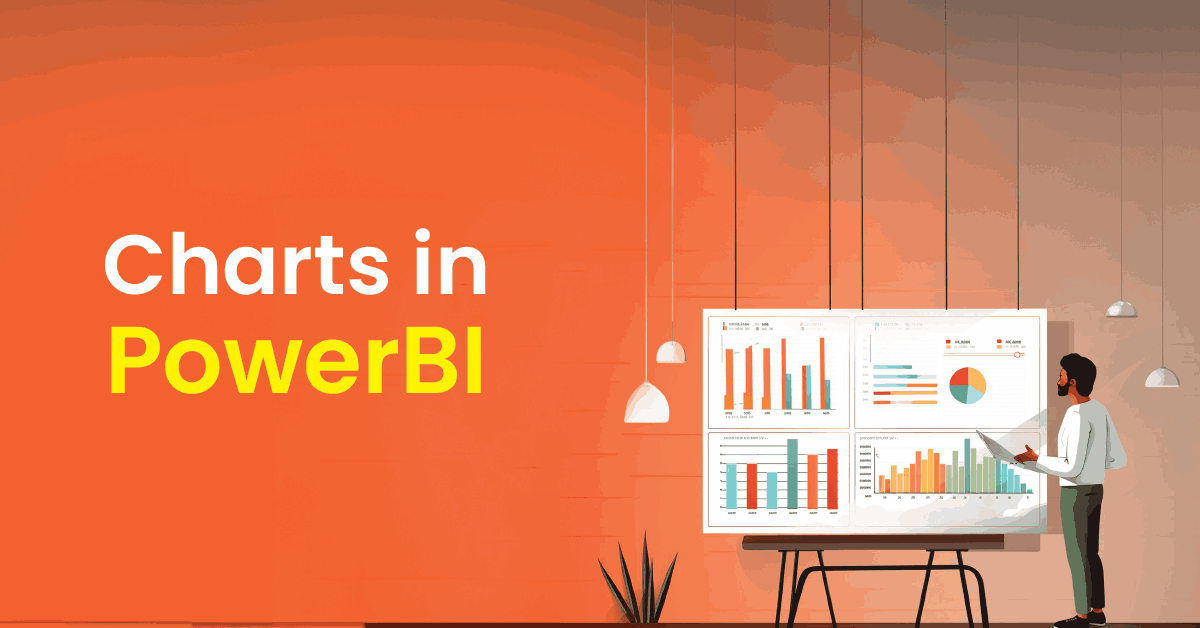
by Mr. Bharani Kumar 12286
Step into a world of data with Power BI's interactive charts. Think of data as a vast landscape full of secrets.
by Mr. Bharani Kumar 11075
In the fast-paced world of data-driven decision-making, having the right tools at your disposal is paramount. One such powerhouse of corporate information is Microsoft's Power BI.

by Mr. Bharani Kumar 14620
We want to look no farther than Microsoft, the company that created the application, for the answer to the question "What is Power BI?" Power BI is described by the company

by Mr. Bharani Kumar 14191
Additionally, Power BI is a collection of software services, applications, and connections that work together to transform data from unconnected sources into coherent, engaging visuals, and interactive insights.
You may also like...

Data Science Roadmap: How to Become a Data Scientist in 2026?

A practical guide to essential tools and libraries across Python, R, SQL, notebooks, and distributions, highlighting when to use options like Pandas, NumPy, scikit-learn, TensorFlow, and Apache Spark.

An overview of in-demand data science roles, required skills, and salary ranges by experience, title, and location, helping readers evaluate career paths and earning potential in 2025.
What stood out most was the programme's practical and structured approach to AI adoption. The industry-specific examples, combined with clear frameworks for evaluating feasibility and designing solutions, made the learning highly relevant to our business.
What stood out most was the trainer's simple way of explaining Data Science and GenAI, and showing us different AI tools that I had not used before. It made me realise how useful these tools can be in our daily work.